# Multicollinearity Assessment & Removal Tool
Allows you to observe and assess the correlations between the variables and to remove high correlates when deemed appropriate.
In certain datasets, some features may be heavily correlated with one another. Sometimes it may be the same feature listed more than once under different names. As you can imagine, especially in datasets with a limited number of features, if certain features are overrepresented, then the value / contribution of other features within that dataset may become diluted which ultimately can deteriorate the ML model’s performance measures. In some cases, to include all of the features within a dataset regardless of their correlations may be desirable. However, evaluating for and removing heavily correlated variables can be another step in the optimization step of your data which could ensure the appropriate contribution of the unique dimensions that are represented within the dataset. This can be assessed with the Multicollinearity Assessment and Removal Tool.
WARNING
The maximum number of features / columns allowed within this tool is 50 since the visualization tool (i.e. the correlation heat map) is best visualized when the number of features are below 50.
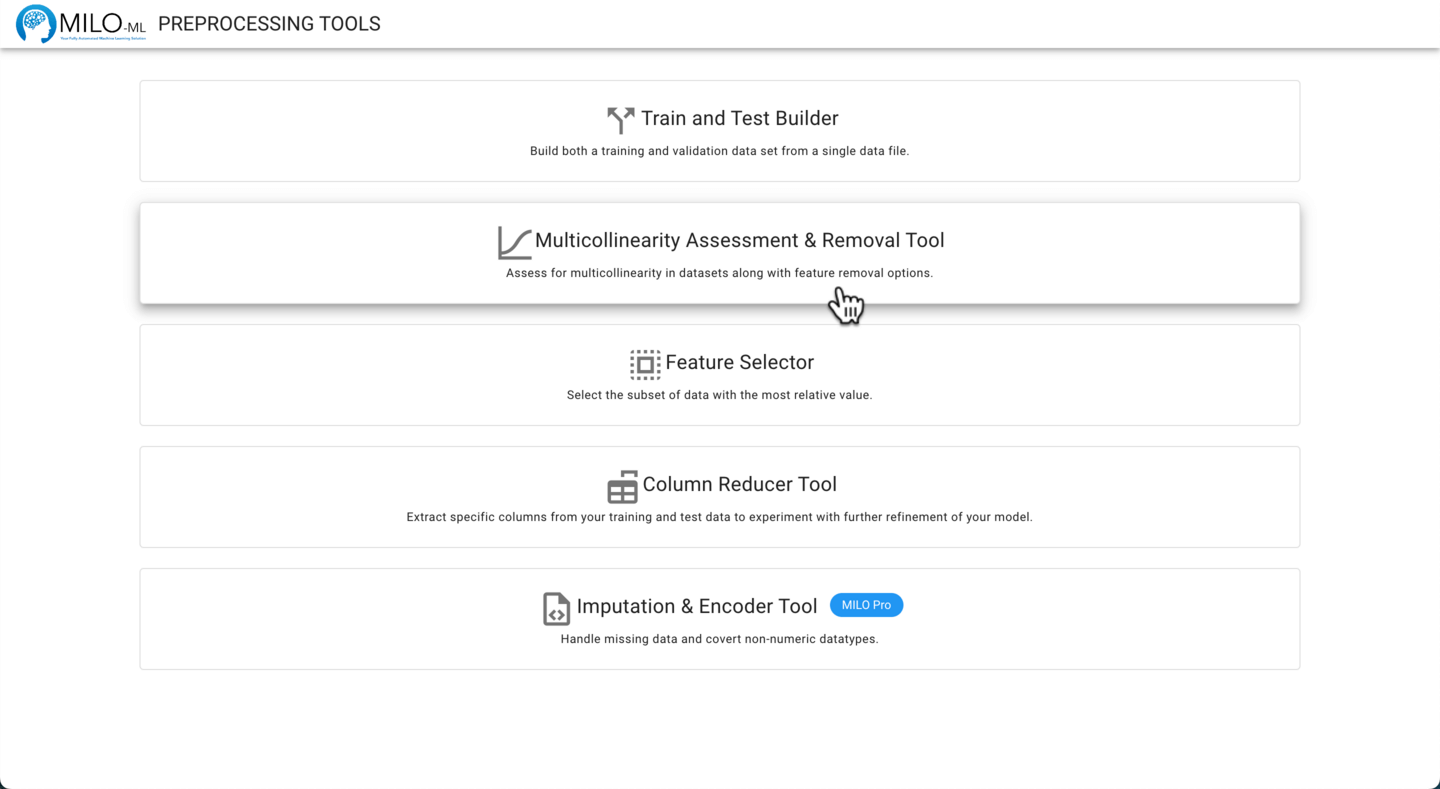
Navigate to the Preprocessing Tools from the MILO home page and then select Multicollinearity Assessment and Removal Tool.
Please refer to the General File Selection Procedure for file selection.
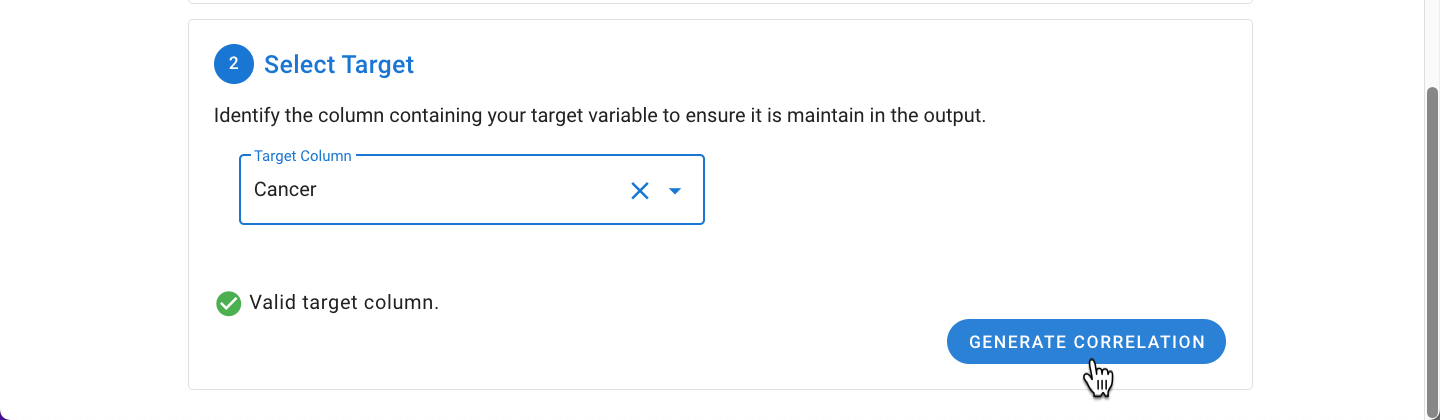
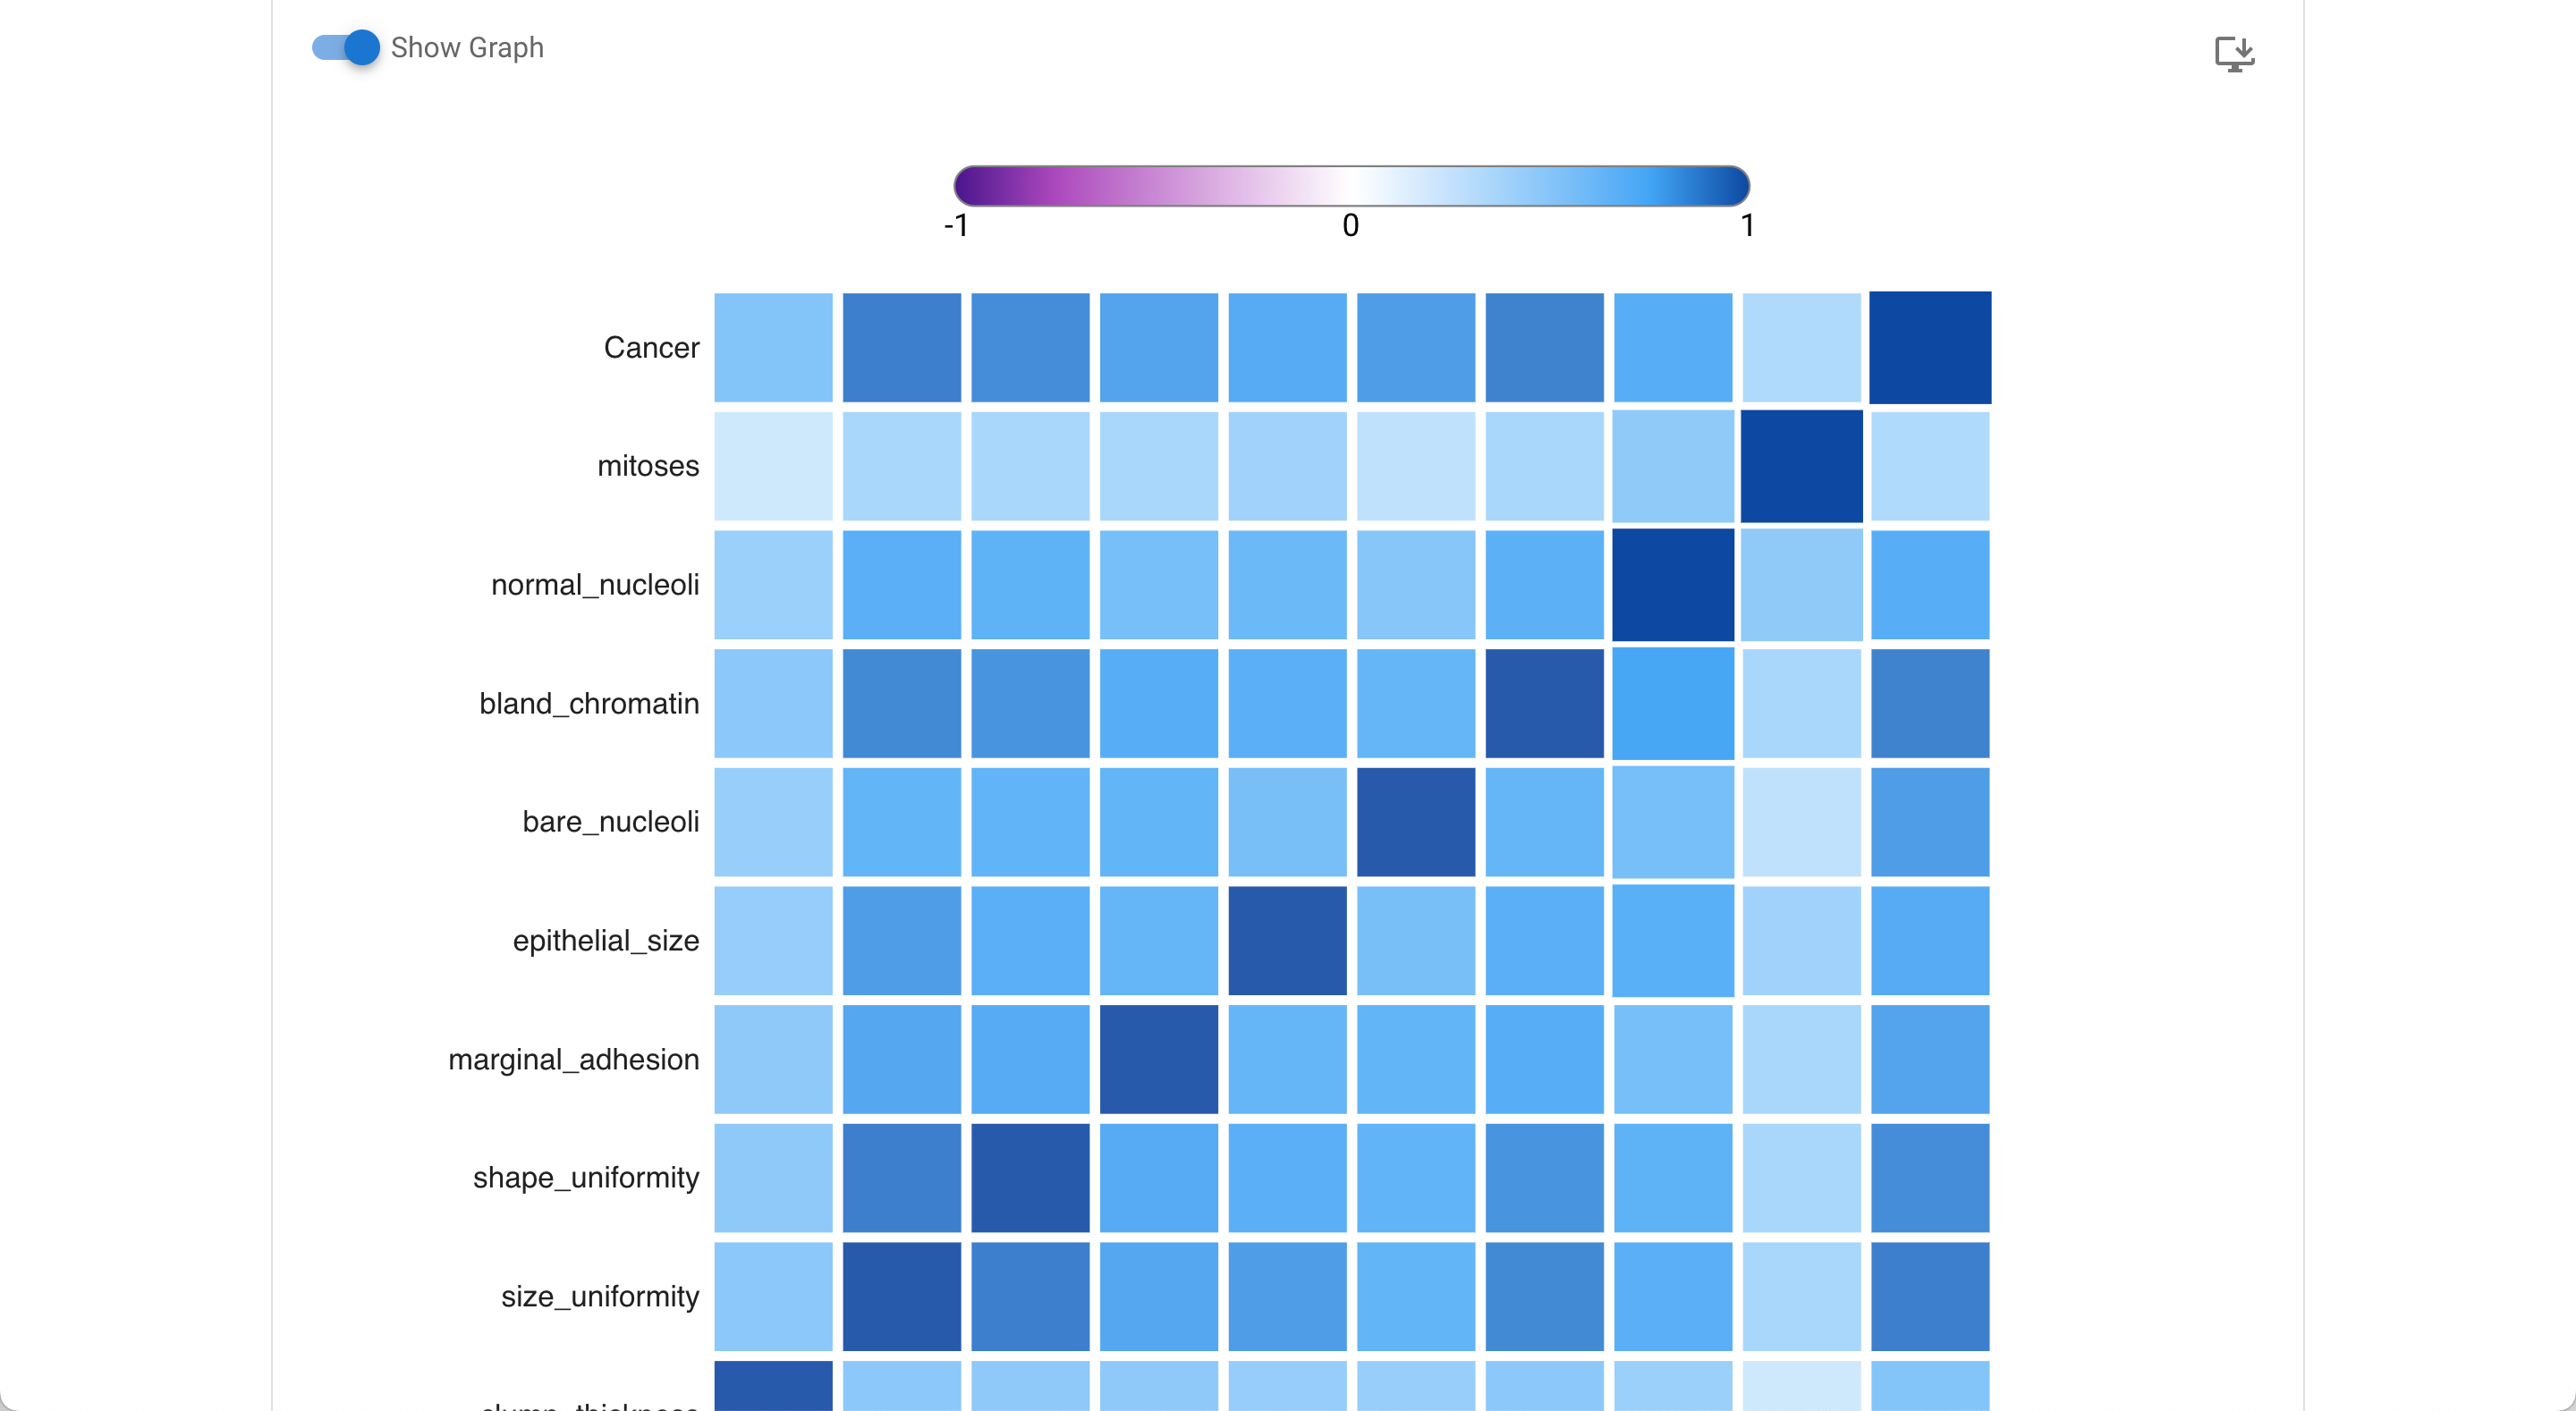
With the target column selected, the correlation can be calculated between all variables by clicking the Generate Correlation button.
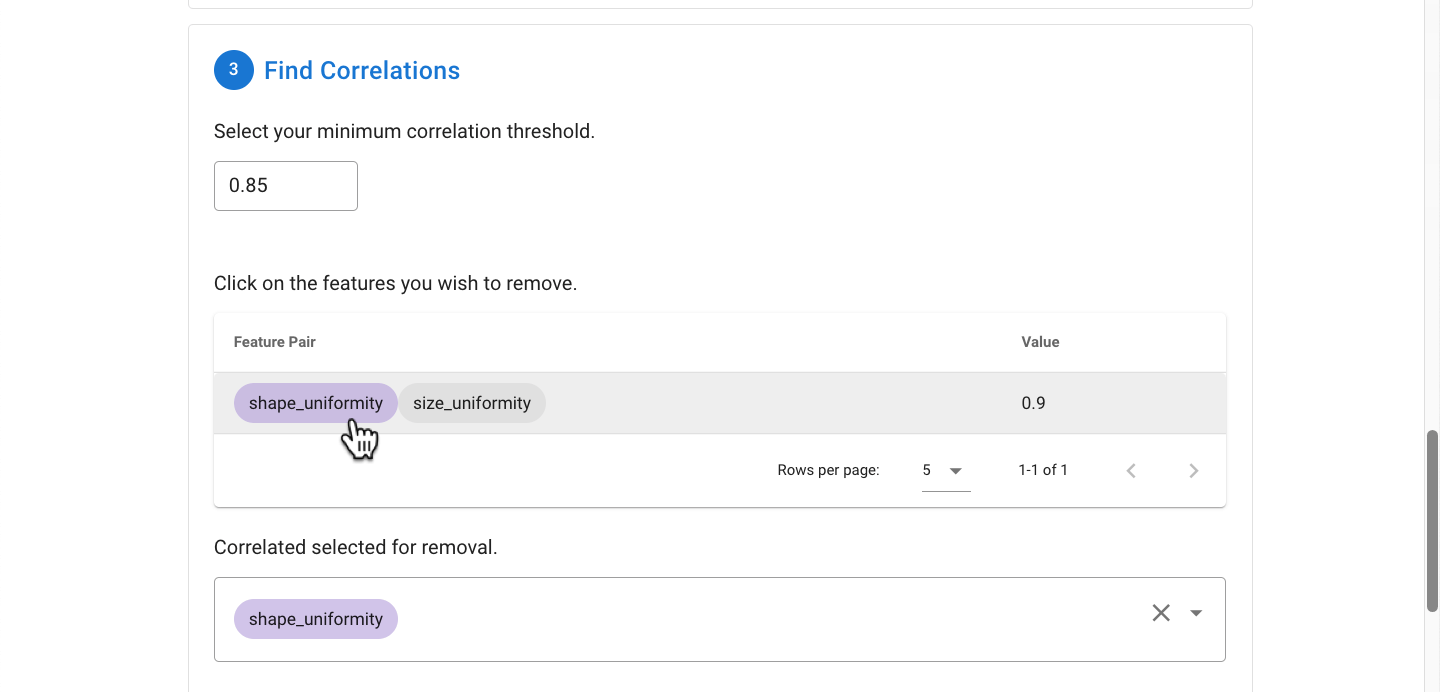
Within this tool, the correlation threshold by default is set to 85% (0.85). This minimum correlation threshold can be adjusted and the output is a list of correlated columns meeting that assigned threshold. Clicking on a specific column will select it for removal and it will be color coded to identify all associated pairings within the list. The columns selected for removal will be down in the dialogue box labeled as "Correlated selected for removal".
Note: If less than 50 columns are present in the dataset, a visual representation of the correlation strength will be displayed to help better explore the correlations. Blue shades reflect a positive correlation, while purple shades reflect a negative correlation. Once done exploring, with the columns for removal selected, the Confirm Features for Removal button can be clicked to advance to the final step.
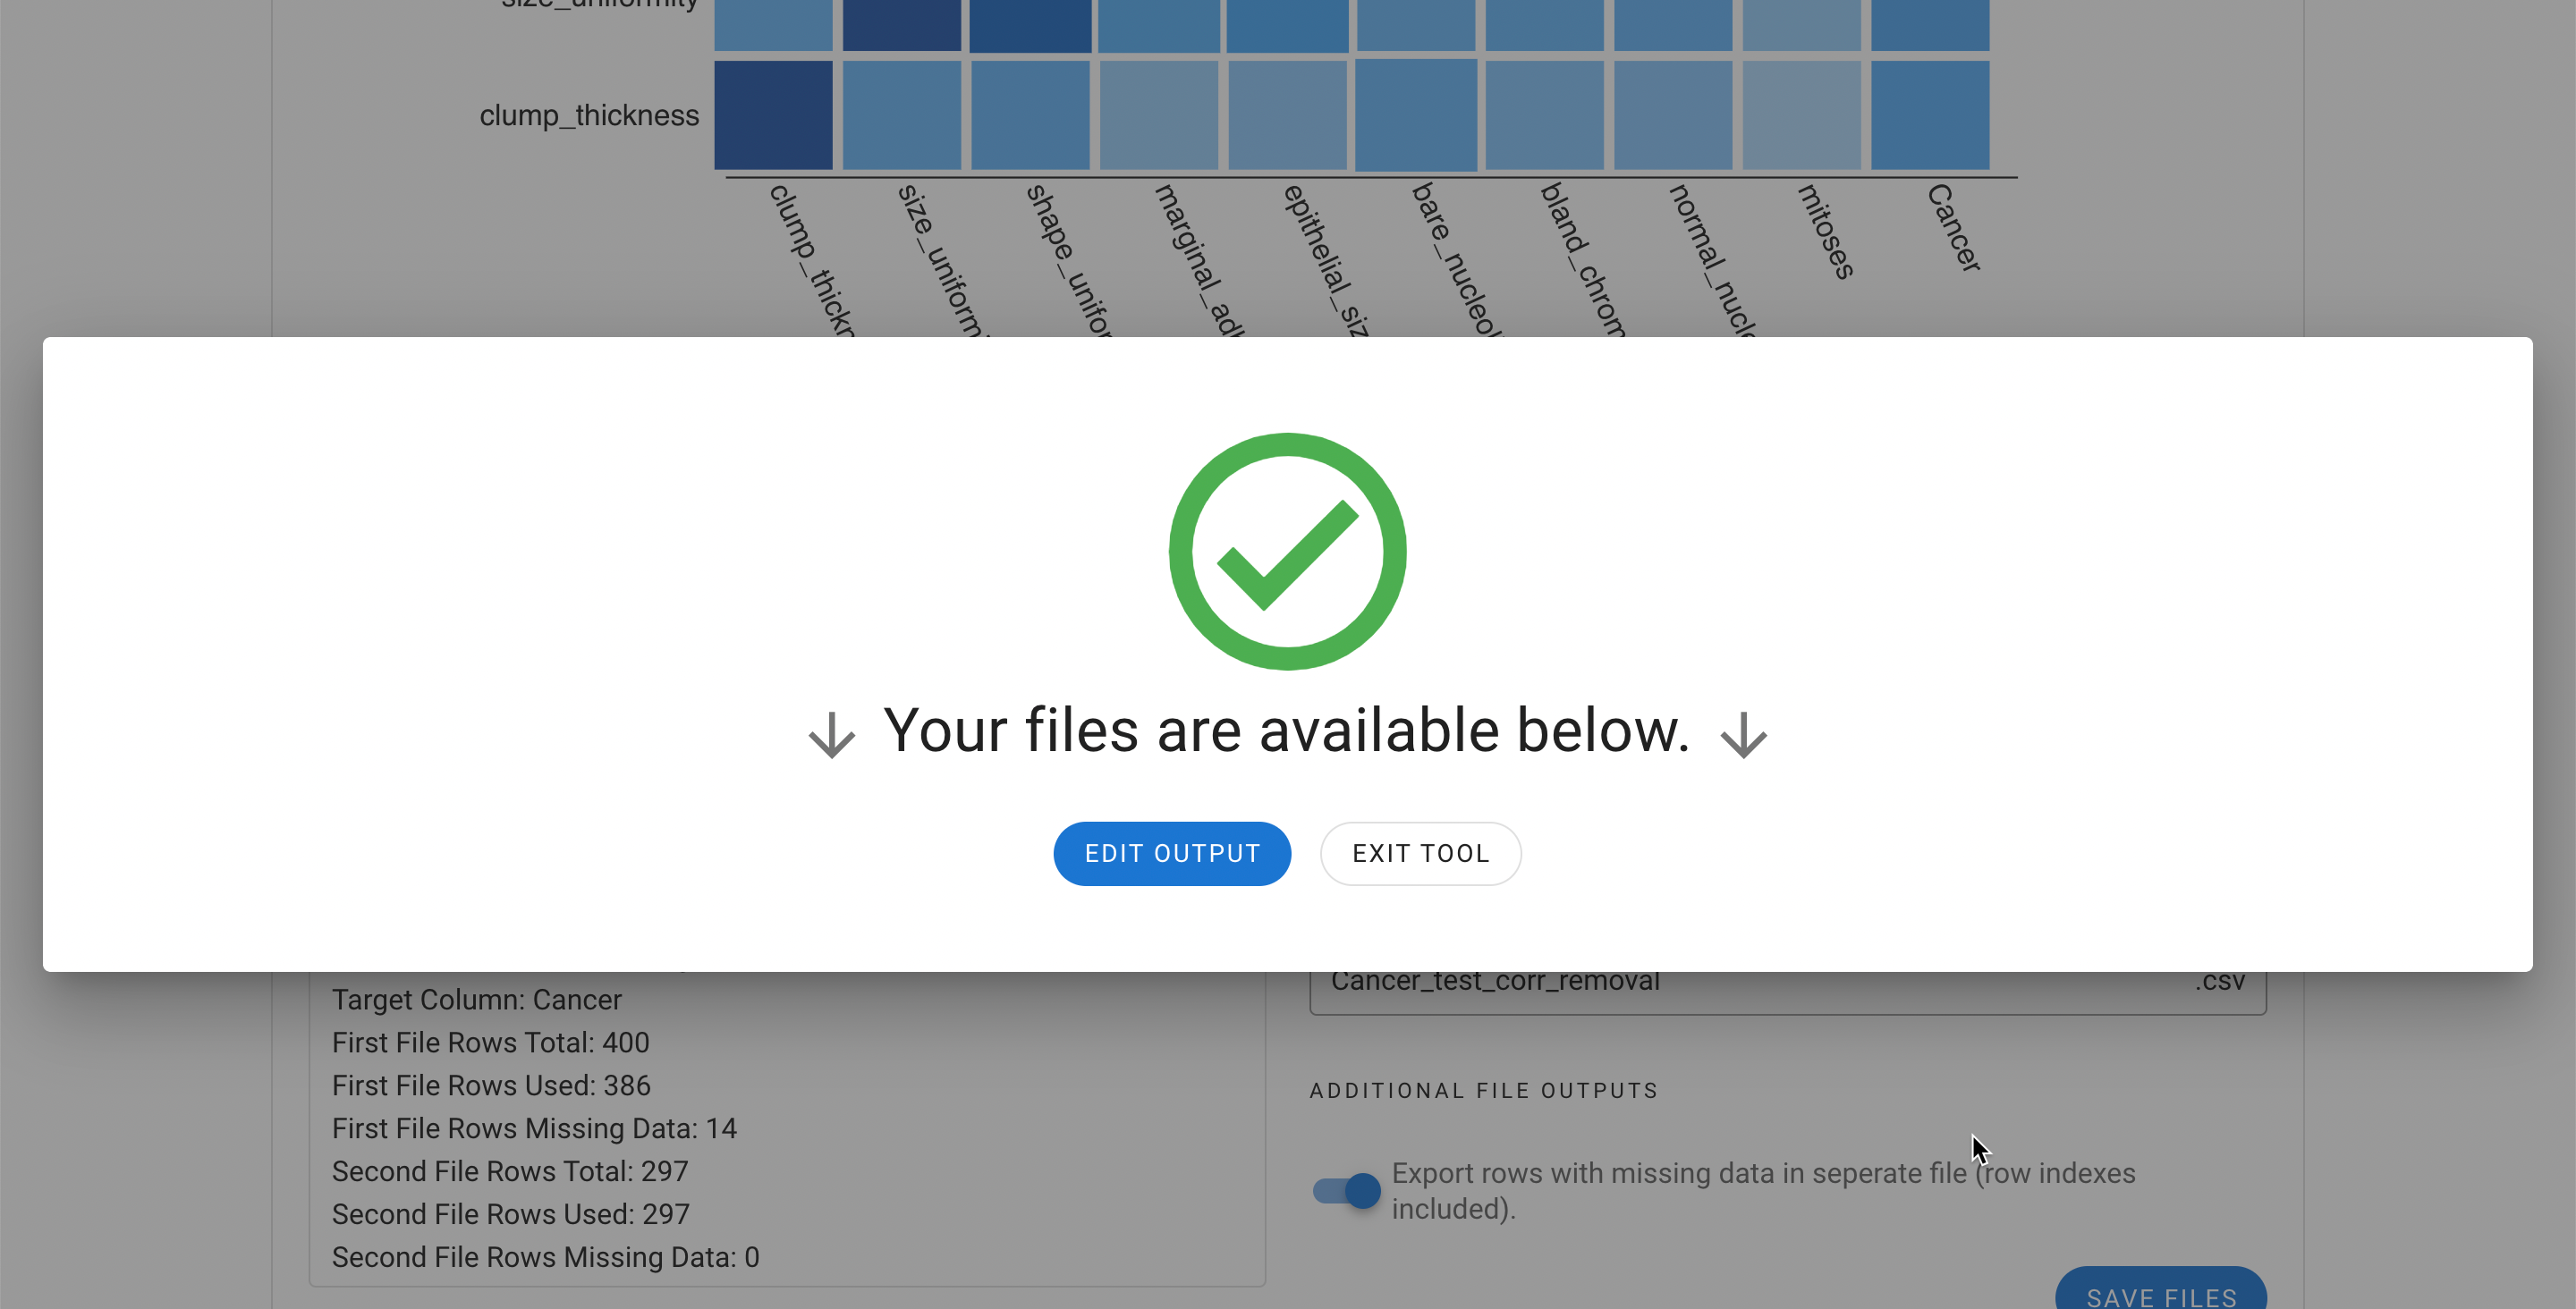
In the final step, a summary of the files will be displayed including the number of output columns, rows, and excluded missing rows. The rows with missing data can be explored as a separate file under "Additional File Outputs".
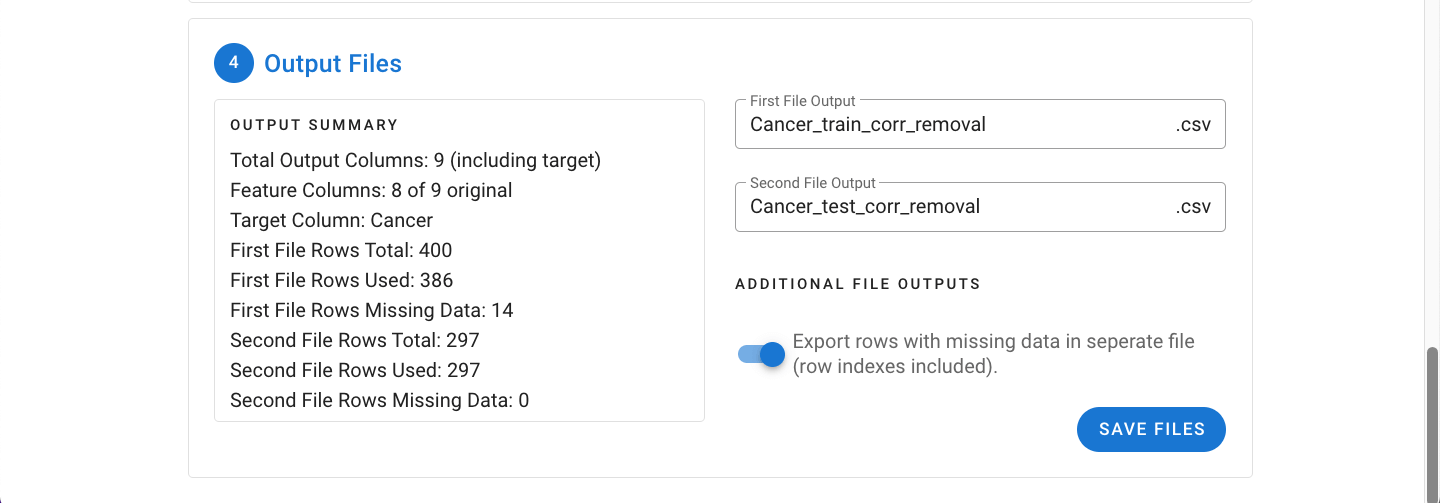
Upon clicking Save Files, the file(s) will be exported as a ZIP file and are now ready to be used in MILO.